PEPE Price Slows Down as Metrics Indicate Corrections

PEPE’s price hit a new all-time high on November 13, after it was listed on Coinbase. It has been up 105% in the past month, though it’s down nearly 10% in the last seven days. Indicators like RSI and MVRV suggest further corrections could occur as bullish momentum weakens.
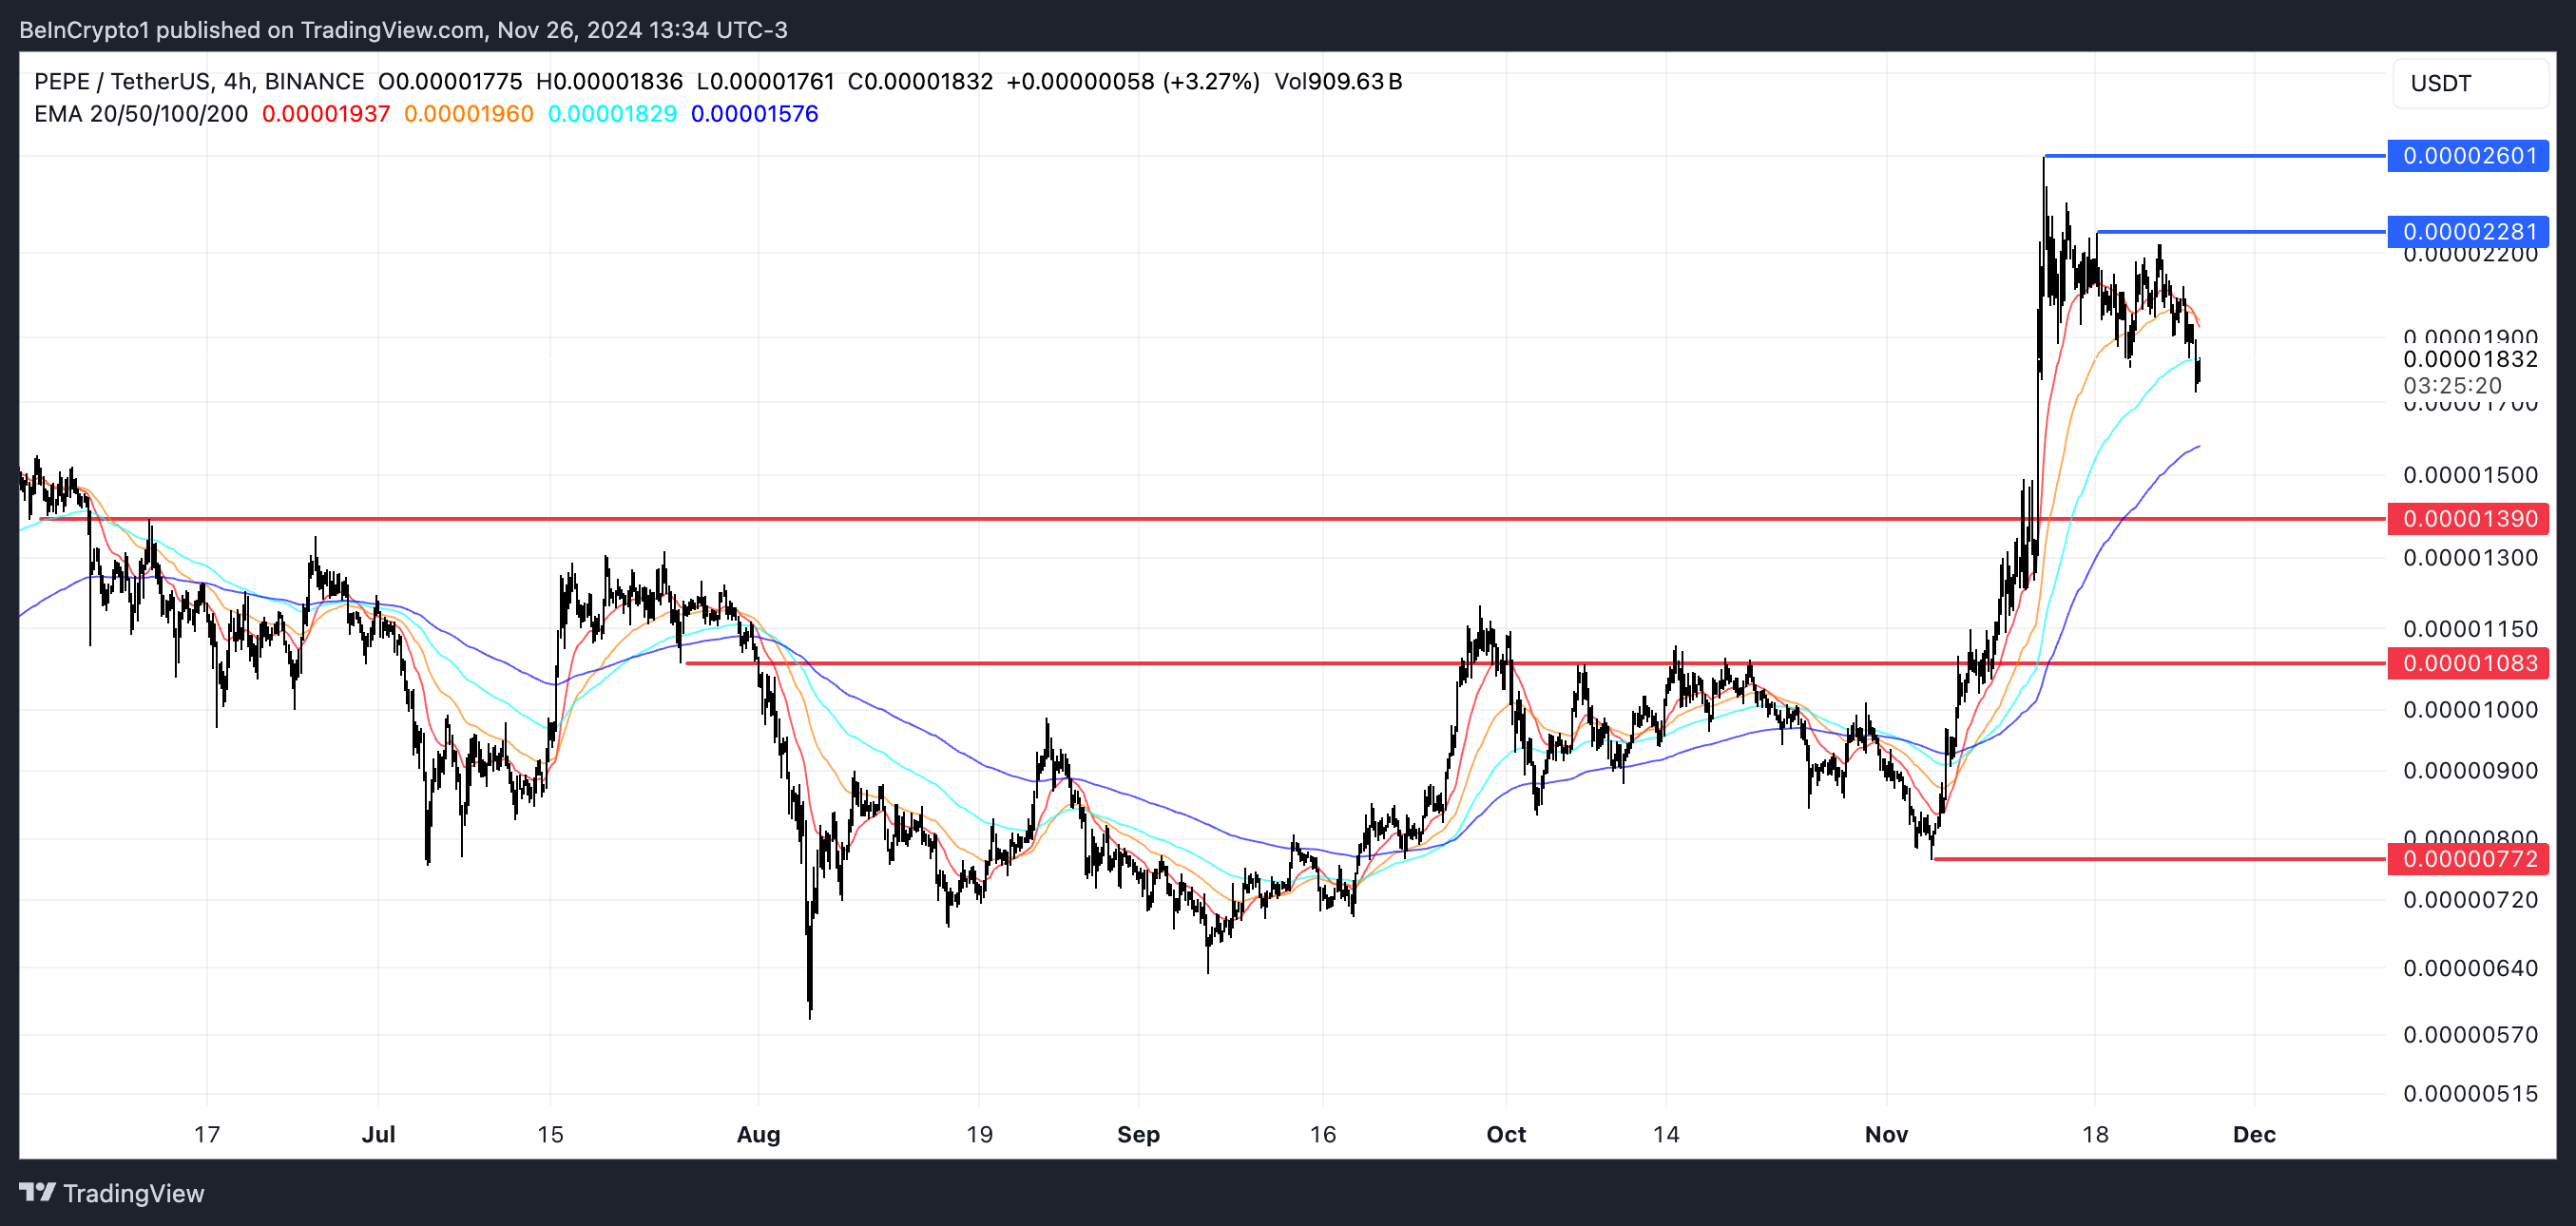
A potential death cross in the EMA lines could push PEPE to key supports at $0.0000139 or lower. However, a trend reversal could see PEPE testing resistances at $0.0000228 and aiming for a new all-time high at $0.000030.
PEPE Isn’t Oversold Yet
PEPE RSI has fallen to 38.8 from 60 in the last three days, indicating weakening bullish momentum. The RSI, or Relative Strength Index, measures price momentum on a scale of 0 to 100, with values above 70 signaling overbought conditions and below 30 indicating oversold levels.
The drop reflects growing selling pressure, but the current RSI suggests PEPE is not yet oversold.
At 38.8, PEPE’s RSI is near a key level, as it hasn’t dropped below 30 since November 3. This suggests the price may stabilize soon if historical patterns hold. The recent drop didn’t change the fact that PEPE is the 3rd biggest meme coin in the market, below DOGE and SHIB.
However, if the RSI dips further below 30, it could trigger stronger bearish momentum and lead to further price corrections.
PEPE MVRV Ratio Shows The Correction Could Continue
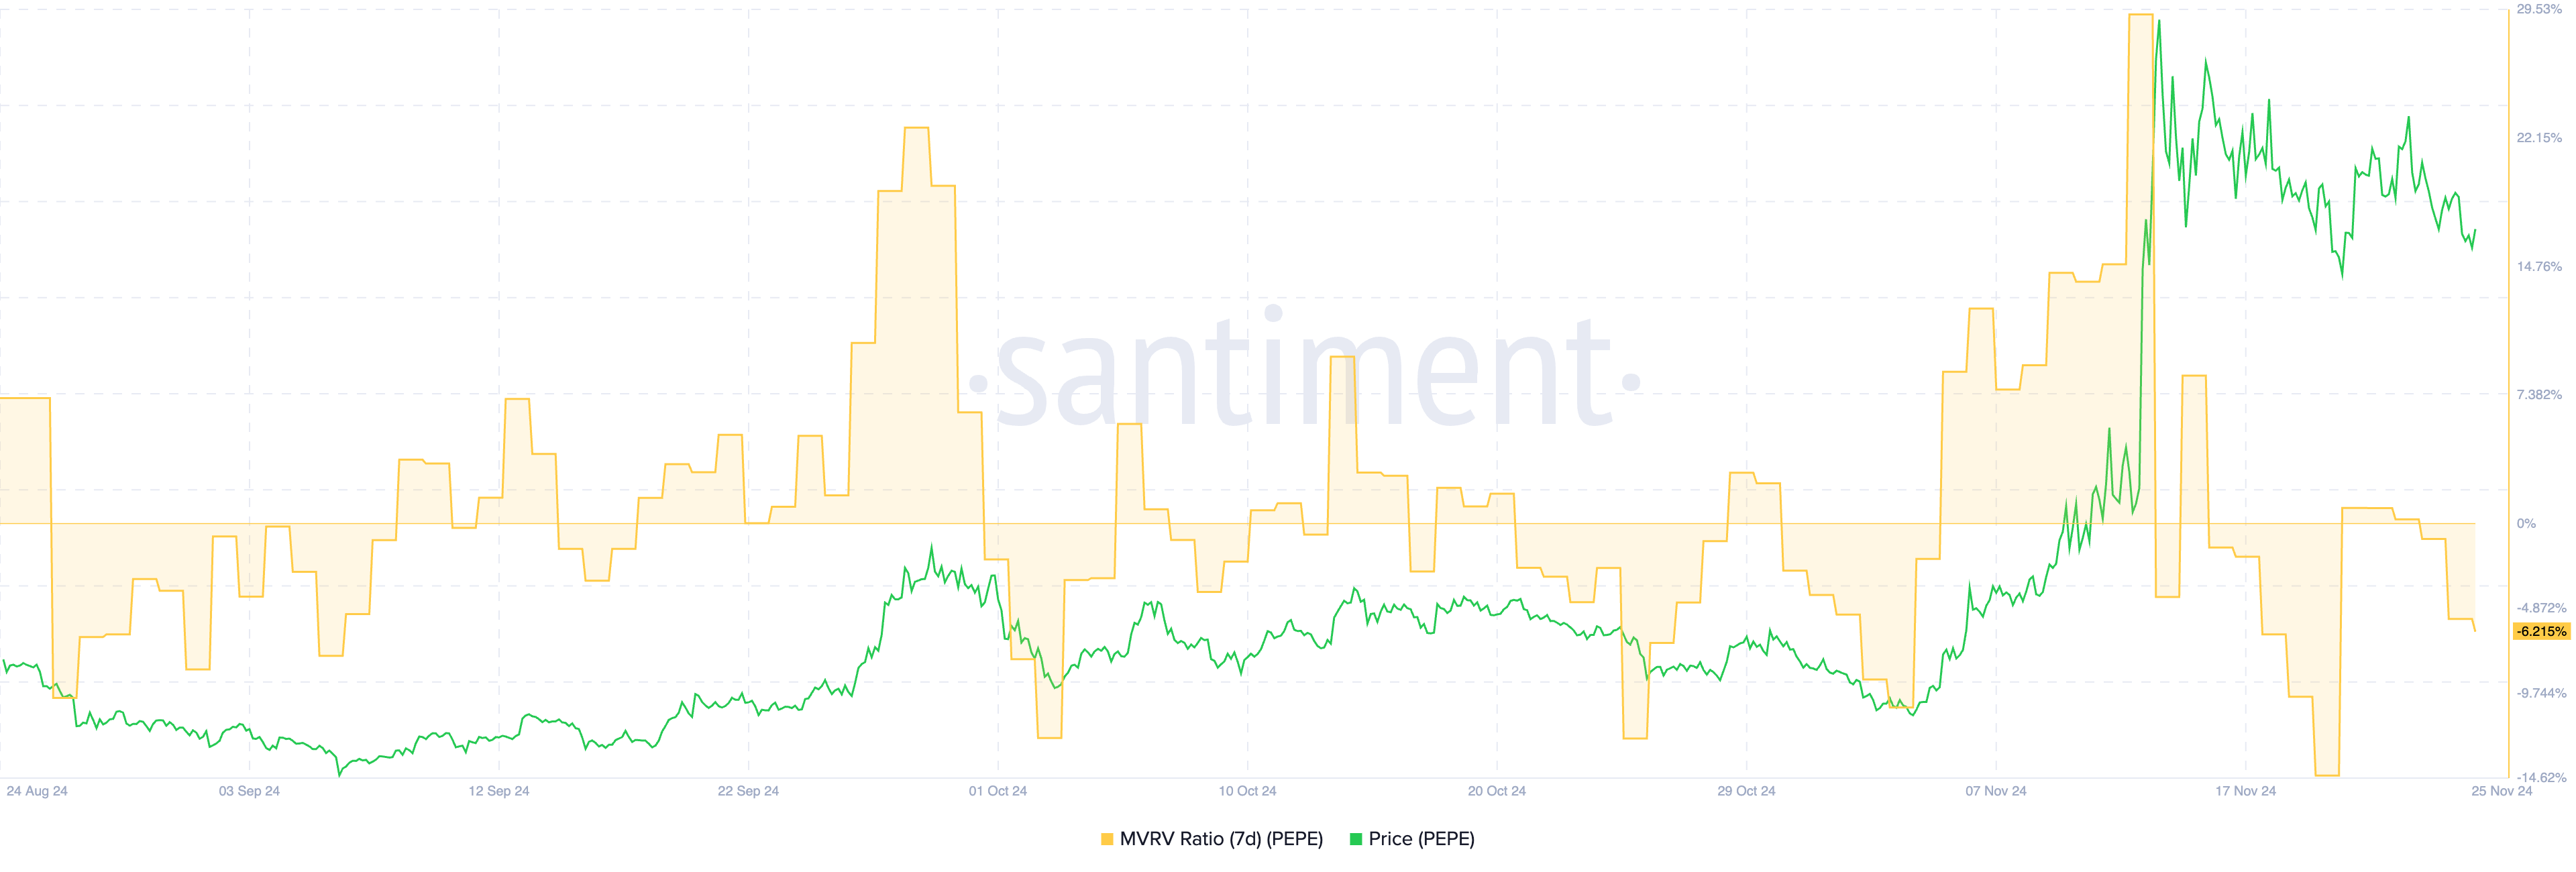
PEPE’s 7-day MVRV ratio is currently at -6.2%, signaling that recent holders are, on average, at a slight unrealized loss. The MVRV, or Market Value to Realized Value ratio, measures the profit or loss of holders based on the token’s market value relative to the price they paid.
Negative MVRV levels such as this suggest reduced selling pressure since holders are less likely to sell at a loss.

Historically, PEPE has seen strong price recoveries when its 7-day MVRV dropped below -9.7%, indicating the potential for further correction before another upward surge.
This pattern suggests that while the current MVRV level hints at consolidation, a deeper dip could create conditions for a bullish rebound. If the MVRV trends lower, it may set the stage for renewed accumulation and a fresh price recovery.
PEPE Price Prediction: New All-Time Highs May Be Postponed For Now
PEPE’s EMA lines show a bearish signal, with a potential death cross-forming, where short-term EMA lines cross below long-term ones.
If this pattern materializes, it could trigger further corrections. PEPE price will likely test support at $0.0000139 and $0.0000108. Should selling pressure intensify, PEPE could fall to $0.0000077.

On the other hand, if market confidence returns and the trend reverses, PEPE price could challenge resistances at $0.0000228 and $0.000026.
Breaking above these levels could push PEPE price toward $0.000030, setting a new all-time high.
Disclaimer
In line with the Trust Project guidelines, this price analysis article is for informational purposes only and should not be considered financial or investment advice. BeInCrypto is committed to accurate, unbiased reporting, but market conditions are subject to change without notice. Always conduct your own research and consult with a professional before making any financial decisions. Please note that our Terms and Conditions, Privacy Policy, and Disclaimers have been updated.


