WIF Price Correction Deepens With Key Support at $2.19 in Focus

Dogwifhat (WIF) price reached its highest levels since March 2024 earlier this month, reflecting an astonishing 1386% gain for the year. However, WIF has faced a correction, declining roughly 11% in the last 24 hours as bearish signals intensify.
Momentum indicators like the Ichimoku Cloud and ADX show strong bearish trends, with sellers firmly in control of the market. Whether WIF can hold key support levels or recover enough strength to test resistance zones will define its short-term trajectory.
Dogwifhat Ichimoku Cloud Shows a Strong Bearish Setting
WIF Ichimoku Cloud chart demonstrates a clear bearish trend as the price has broken below both the Kumo cloud and all major Ichimoku components. The conversion line (blue) has crossed below the baseline (red), creating a bearish signal. The lagging span, shown in green, has also moved significantly below the price, indicating strong downward momentum.
Since early December, the price action has consistently made lower highs and lower lows, with the latest movement showing an aggressive bearish drop.
In early December, the cloud structure transformed from a supportive green bullish cloud to a red bearish cloud formation, with Leading Span A (red) crossing below Leading Span B (orange). This cloud color change and expansion suggest increasing bearish pressure.
The fact that the price is trading well below the cloud, with all Ichimoku components aligned above the current price – the conversion line, base line, and both cloud spans – suggests a strong bearish trend continuation is likely unless the price can reclaim at least the conversion line level.
WIF ADX Shows the Current Downtrend Is Getting Stronger
WIF ADX is currently at 38, up from 36 yesterday, signaling a strong and growing trend. However, with WIF in a downtrend, the rising ADX indicates strengthening bearish momentum. This suggests the downward movement is likely to continue, as sellers remain dominant in the market.

The ADX (Average Directional Index) measures the strength of a price trend without indicating its direction. An ADX above 25 signifies a strong trend, while readings below 20 suggest a weak or non-trending market.
With dogwifhat ADX at 38 and its current downtrend, the price may face further decrease in the short term unless buying activity emerges to counter the bearish momentum. If sellers persist, WIF price could experience continued declines before finding stability.
Dogwifhat Price Prediction: Can WIF Get Back to $4 Until 2025?
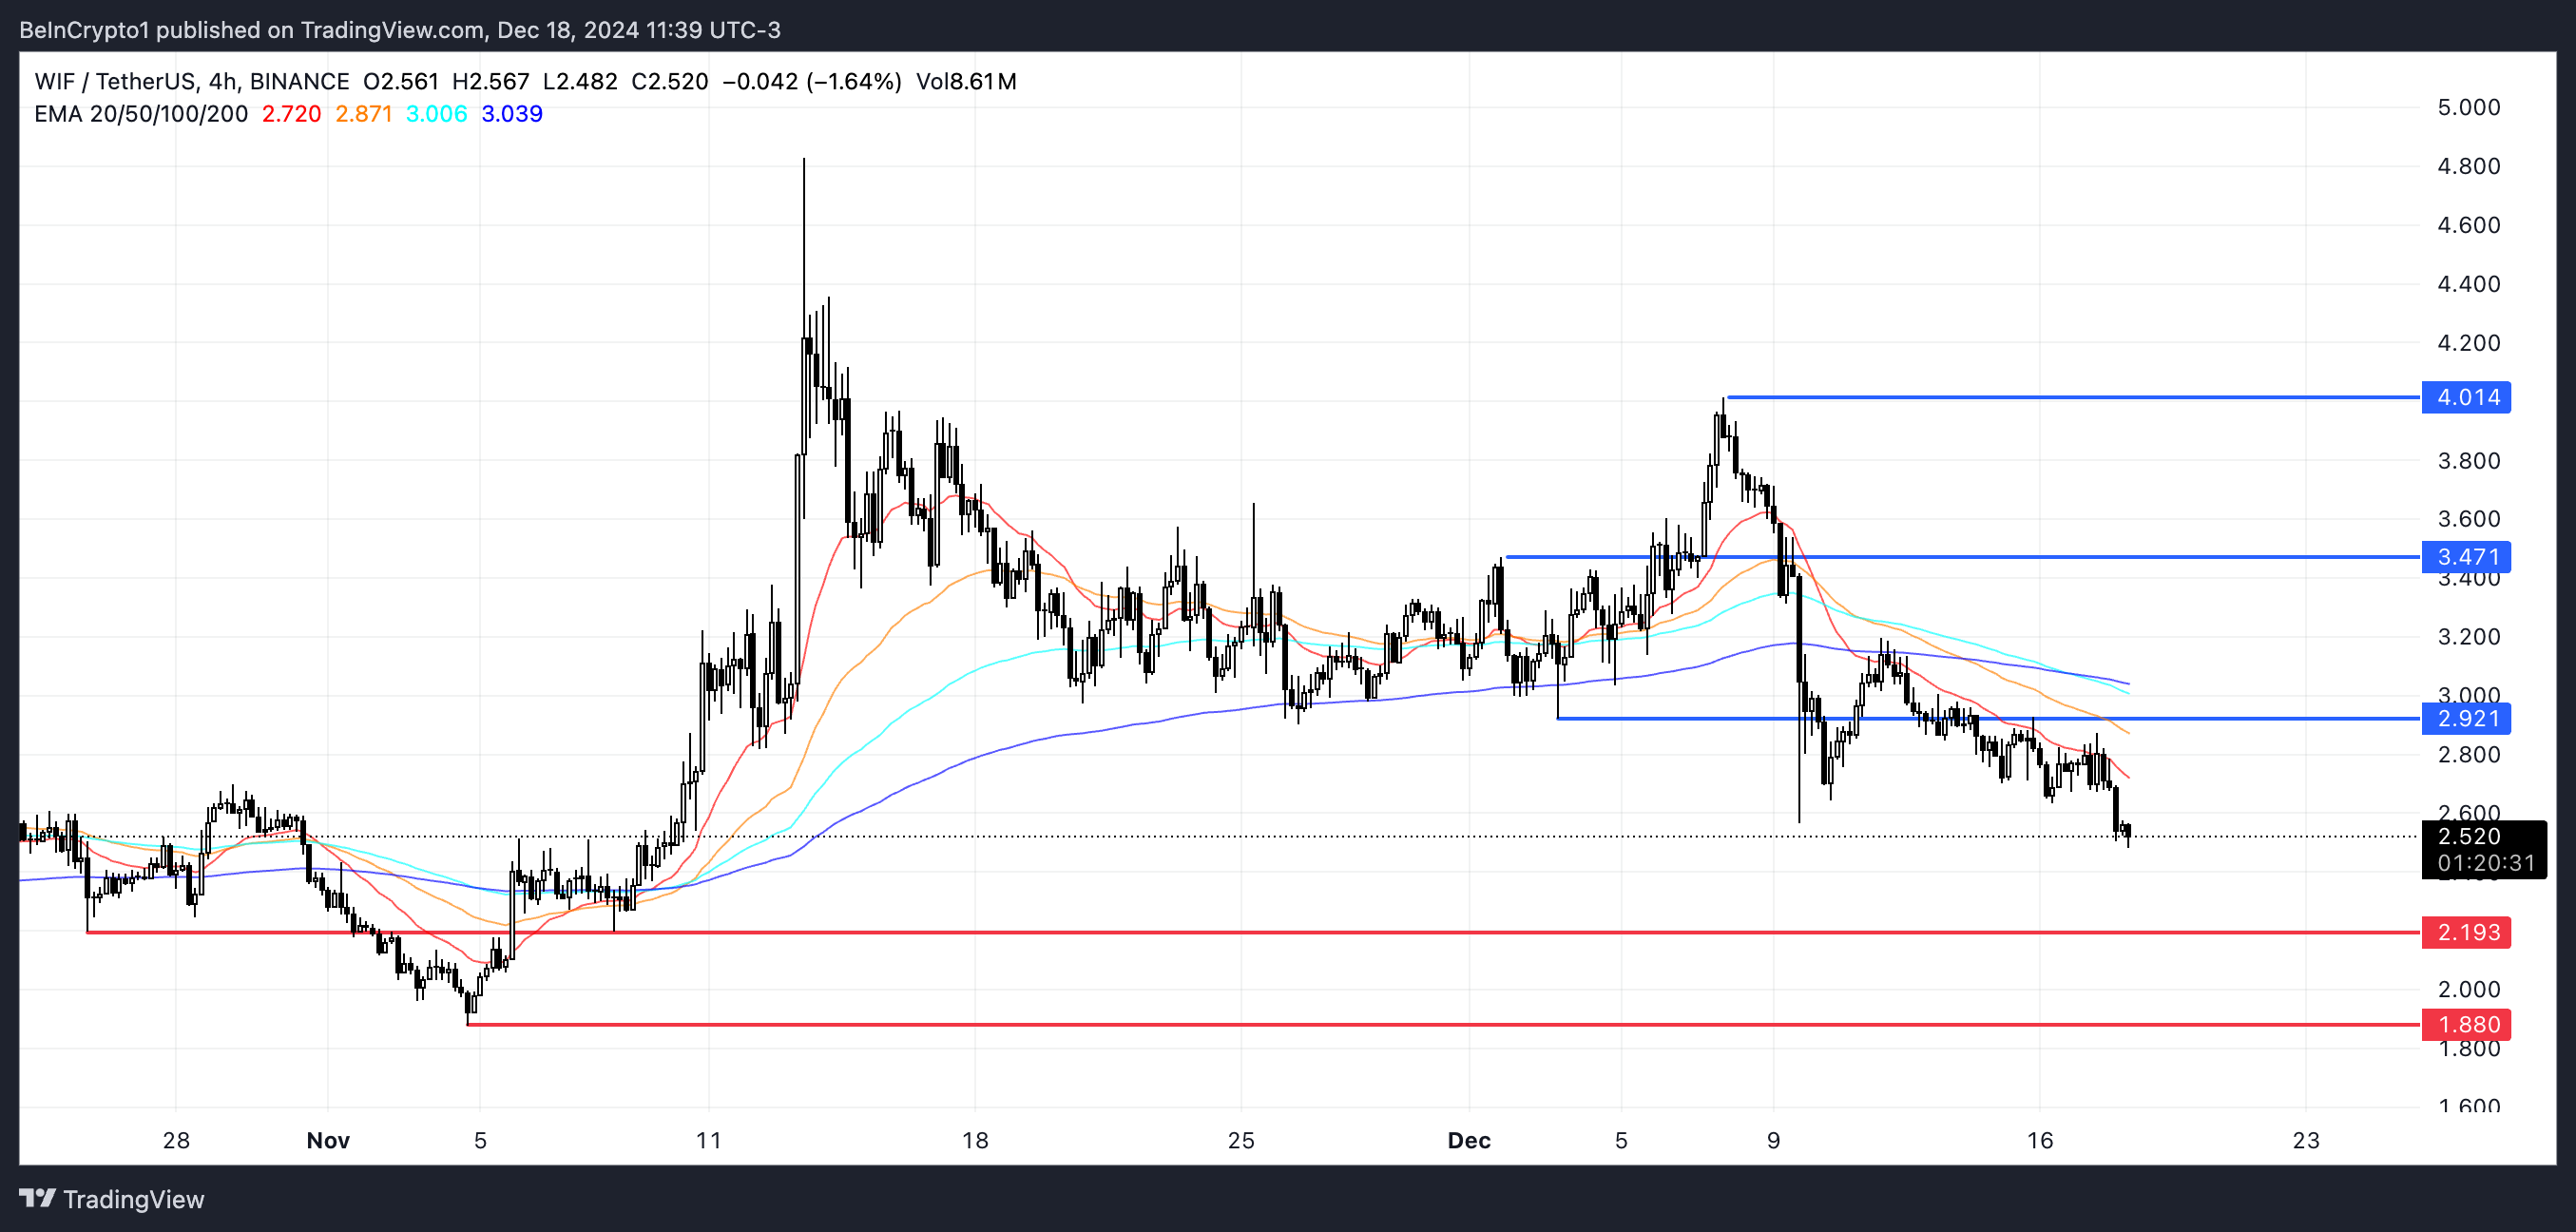
WIF EMA lines currently display a bearish configuration, with short-term EMAs positioned below long-term ones. This setup suggests continued downward pressure, and WIF is likely to test the support at $2.19.
If this level fails to hold, WIF price could decline further, potentially reaching $1.88 as the next significant support.

On the other hand, if WIF price manages to reverse its downtrend and regain positive momentum, it could challenge the resistance at $2.91.
A successful breakout above this level could pave the way for further gains, with targets at $3.47 and possibly even $4 if the uptrend gains strength.
Disclaimer
In line with the Trust Project guidelines, this price analysis article is for informational purposes only and should not be considered financial or investment advice. BeInCrypto is committed to accurate, unbiased reporting, but market conditions are subject to change without notice. Always conduct your own research and consult with a professional before making any financial decisions. Please note that our Terms and Conditions, Privacy Policy, and Disclaimers have been updated.


